Budget template (Excel) by month and cost centre
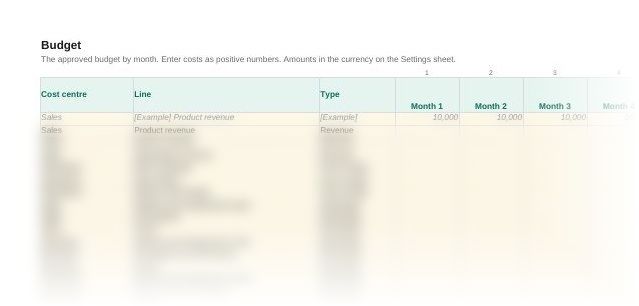
Set the annual budget by month and cost centre, load actuals as each month closes and keep a 24-month forecast on the same rows, so you always see the full-year outturn against budget. This budget template is one Excel workbook for a company budget, with a review sheet and a summary by cost centre.
Finance teamsGet this pack and 51 more for $79
Want every pack, for every region? Global library, 110 packs, $99
What the workbook looks like
When you need it
A budget is the financial plan for the year that the board approves and holds the business to. Built by month and cost centre, it shows each budget holder what they can spend and when, and gives every month's actuals something to be measured against. Use this workbook when:
- You are setting next year's budget and want it by month, not as one annual figure
- Budget holders need their own cost centre lines to fill in
- The board wants to see where the year will end, not just the year to date
- The budget and the forecast sit in separate spreadsheets that never quite agree
How to use the budget template
- Fill in Settings. Company name, currency, the first month of the financial year, your cost centres and the two variance thresholds.
- Set up the lines. Replace the line names on the Budget sheet with your chart of accounts. Give each row a cost centre and a type.
- Enter the approved budget. Twelve months for each line, with costs as positive numbers. Copy months 1 to 12 into the Forecast sheet as the first forecast, then add months 13 to 24.
- Load actuals each month. Paste the month's actuals into the Actuals sheet on the same rows and add 1 to Months of actuals loaded. The Review and the next 12 months move on by a month.
- Revise the forecast and clear the checks. Budget holders change the forecast for the remaining months and add a new 12th month. Every line marked Add commentary gets a comment before the figures go out.
Questions
How do you create a budget in Excel?
List your cost centres and your chart of accounts, then set one row for each cost centre and line, with a column for each month. Mark each row as revenue, cost of sales or overheads so the totals add up to gross profit and operating profit. This template has that layout ready, with actuals and a forecast on matching rows.
What is the difference between a budget and a forecast?
The budget is fixed for the year once the board approves it. It is the target. The forecast is the best current view of what will happen, and it changes every month as actuals arrive.
What is a rolling forecast?
A forecast that always looks the same distance ahead. Each time a month closes, actuals replace it and a new month is added at the end, so the forecast keeps covering the next 12 months. The Forecast sheet runs for 24 months so there is always room for the next 12.
What does the full-year outturn show?
Actuals for the months already closed plus the forecast for the months still to come. Comparing it with the full-year budget shows where the year will end, which the year-to-date figures alone don't.
Is a positive variance good or bad?
In this workbook a positive variance is always good for profit: revenue above budget or costs below it. A negative variance is bad for profit. Costs go in as positive numbers and the line's type sets the sign.
Also in the budget and rolling forecast
Who it's for
Finance teams, FP&A and financial controllers in small and mid-sized companies that budget in Excel.
Last checked
Checked in November 2026.